
See architecture signals in context
Explore KPI dashboards, dependency graphs, heat maps, relationship matrices, and portfolio views in context.
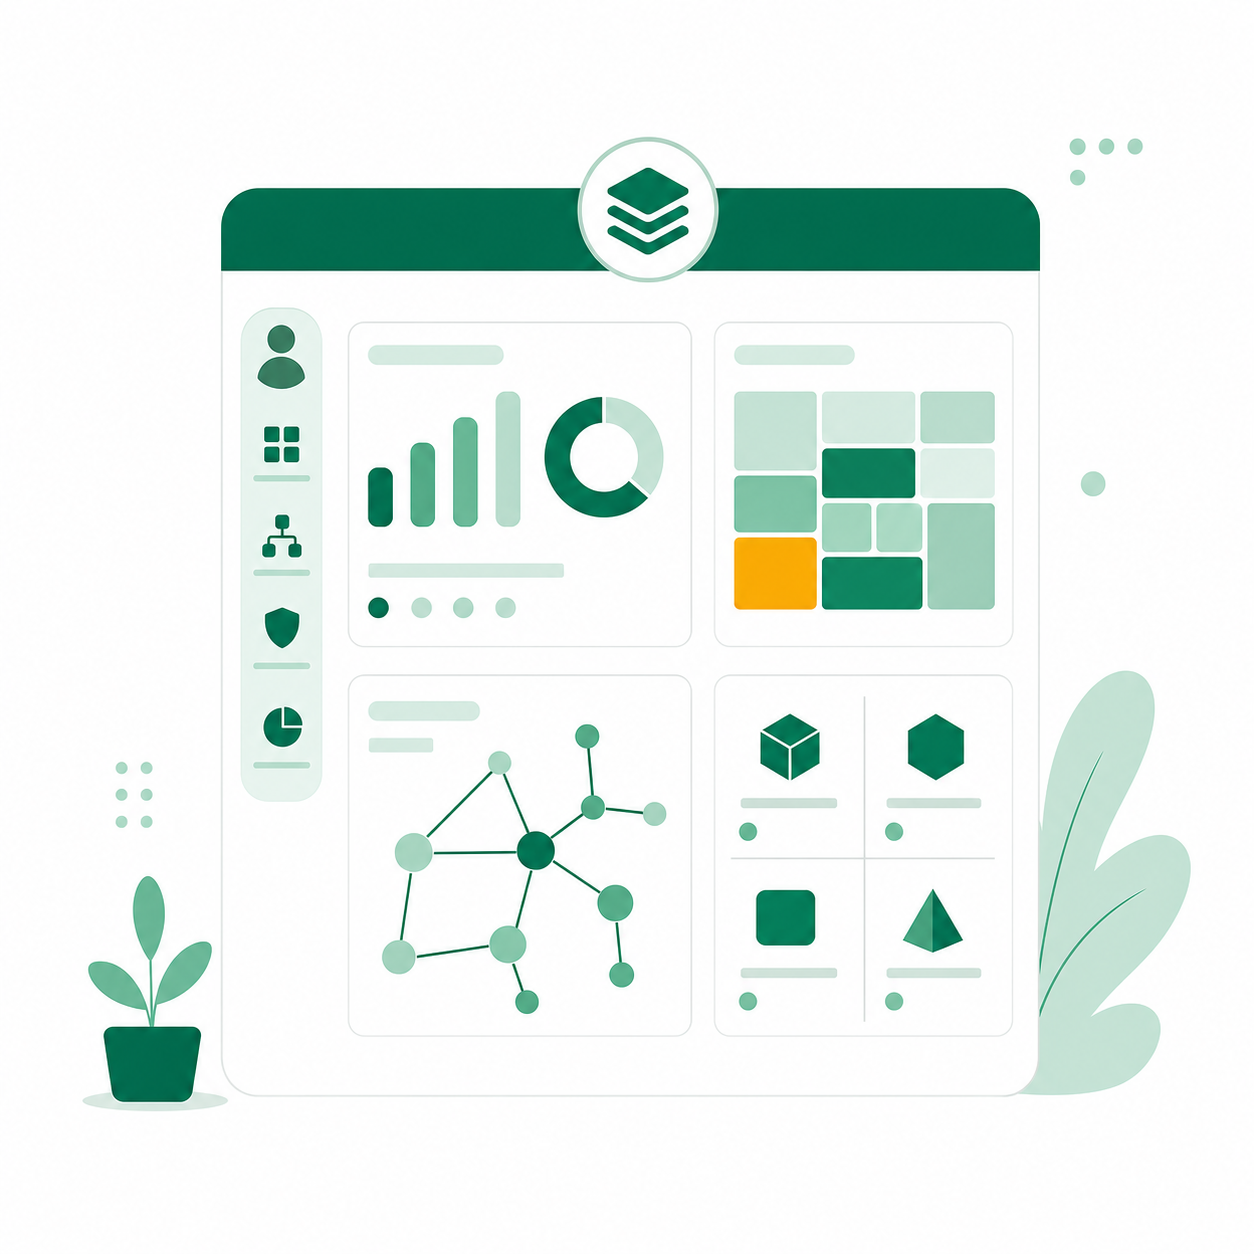
Current analytics and portfolio views
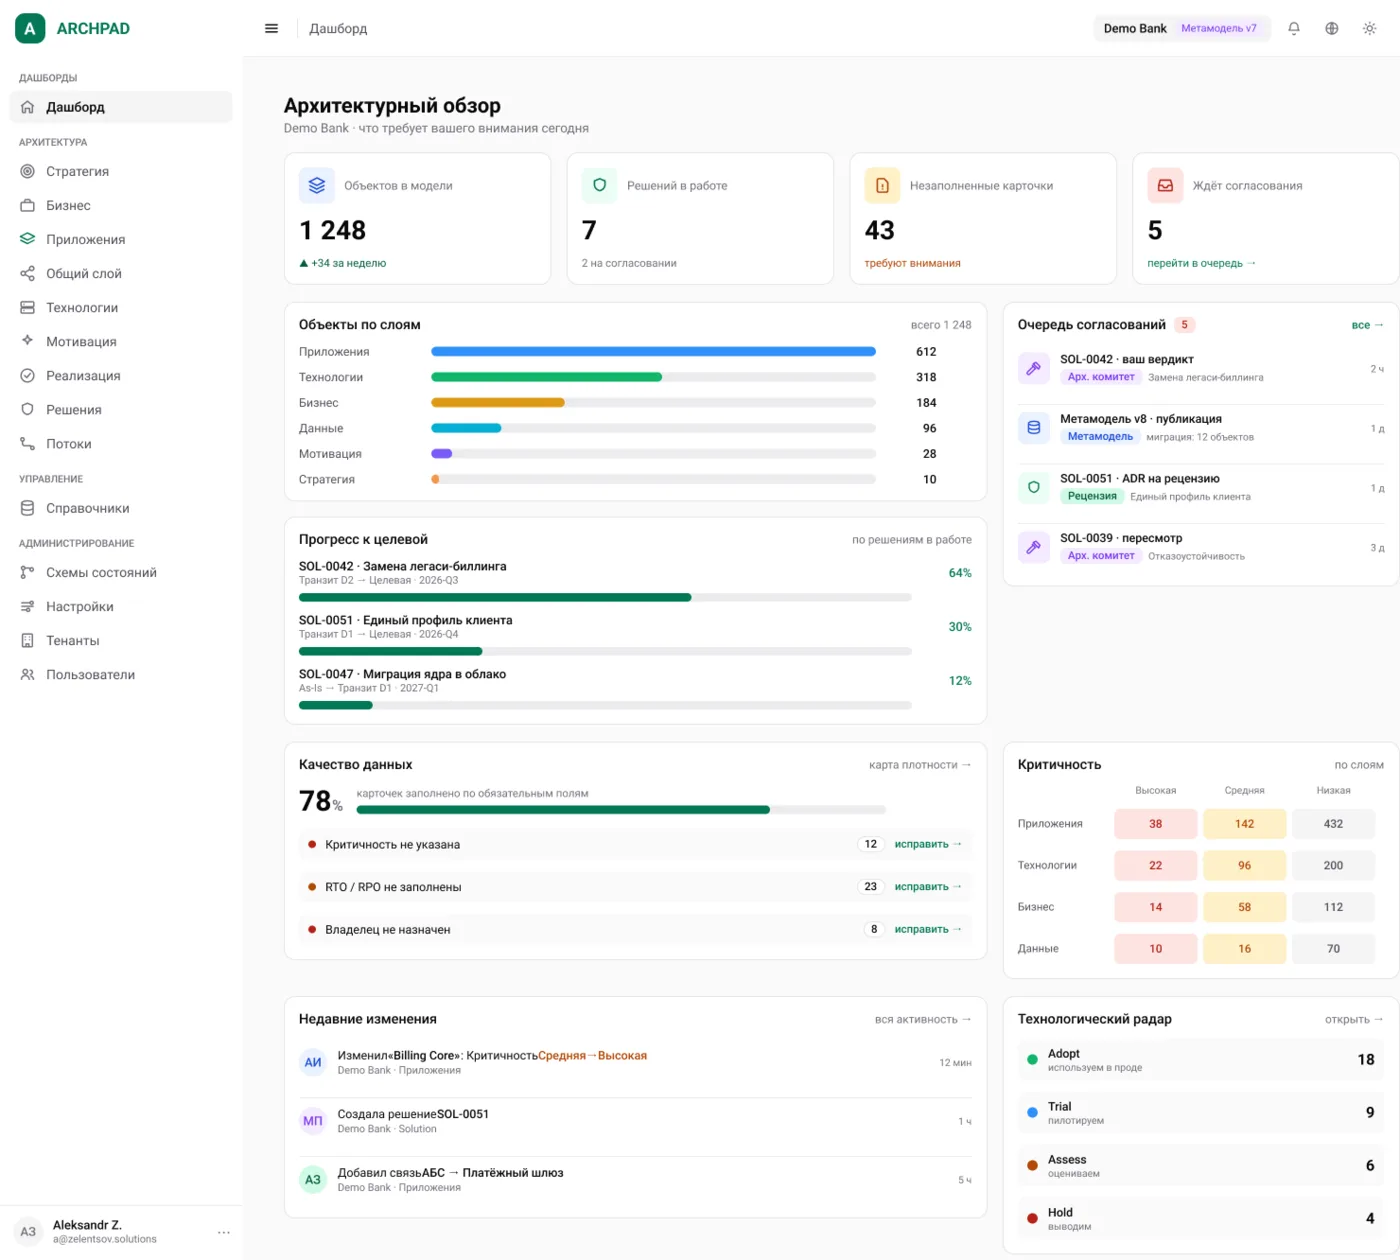
Configurable KPI dashboards
Risk and capability heat maps
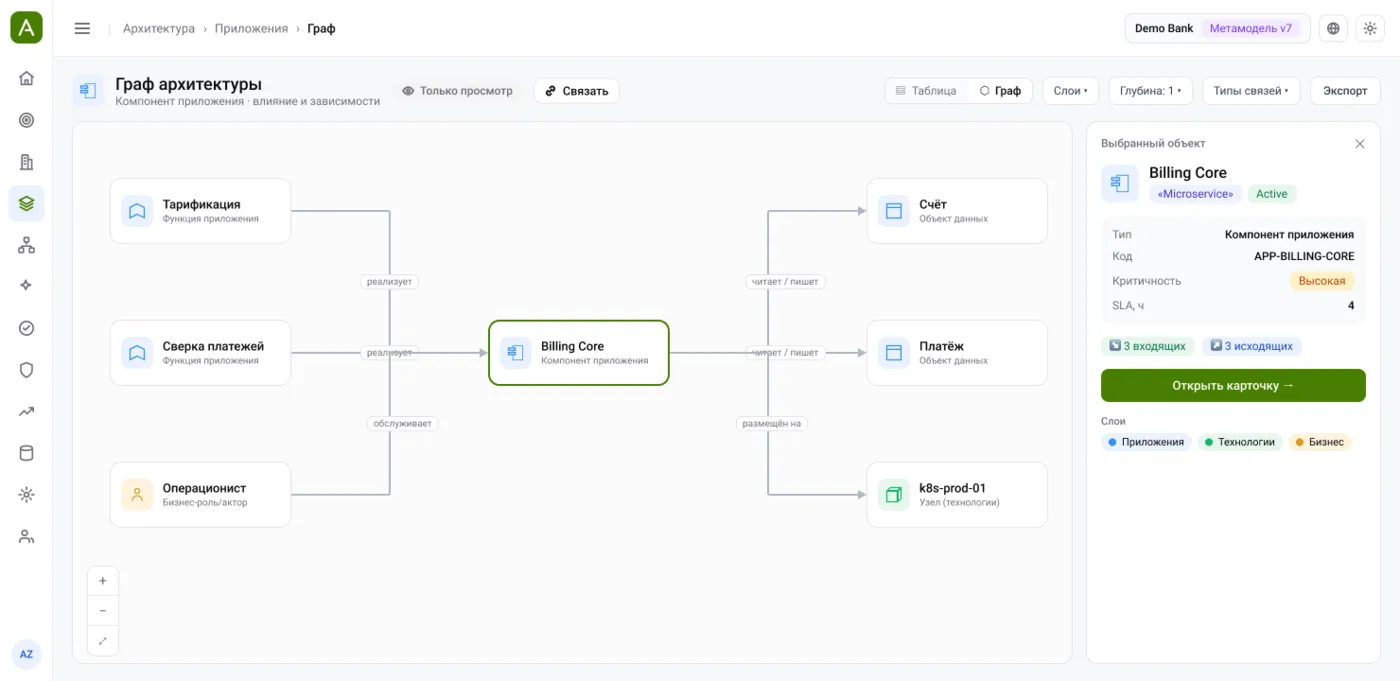
Dependency graph
Relationship matrices
Lifecycle and portfolio views
KPI trends
Key capabilities
Configurable KPI dashboards
Configure KPI widgets for architecture and portfolio context
Risk and capability heat maps
Explore risk and capability signals as heat maps
Dependency graph
Inspect dependencies with direction and depth controls
Relationship matrices
Review relationships between architecture objects in matrix views
Lifecycle and portfolio views
Compare lifecycle and portfolio signals
KPI trends
Track KPI changes over time
Predictive forecasting
Coming soonTrack changes over time and forecast architectural risks
Report designer
Coming soonReport designer
Benefits of analytics
Objective assessment of architecture health
Spot problem areas before they become critical
Back architectural decisions with data
Transparency for stakeholders and leadership
Track progress on architecture initiatives
Optimise architecture based on facts
ArchPad in action
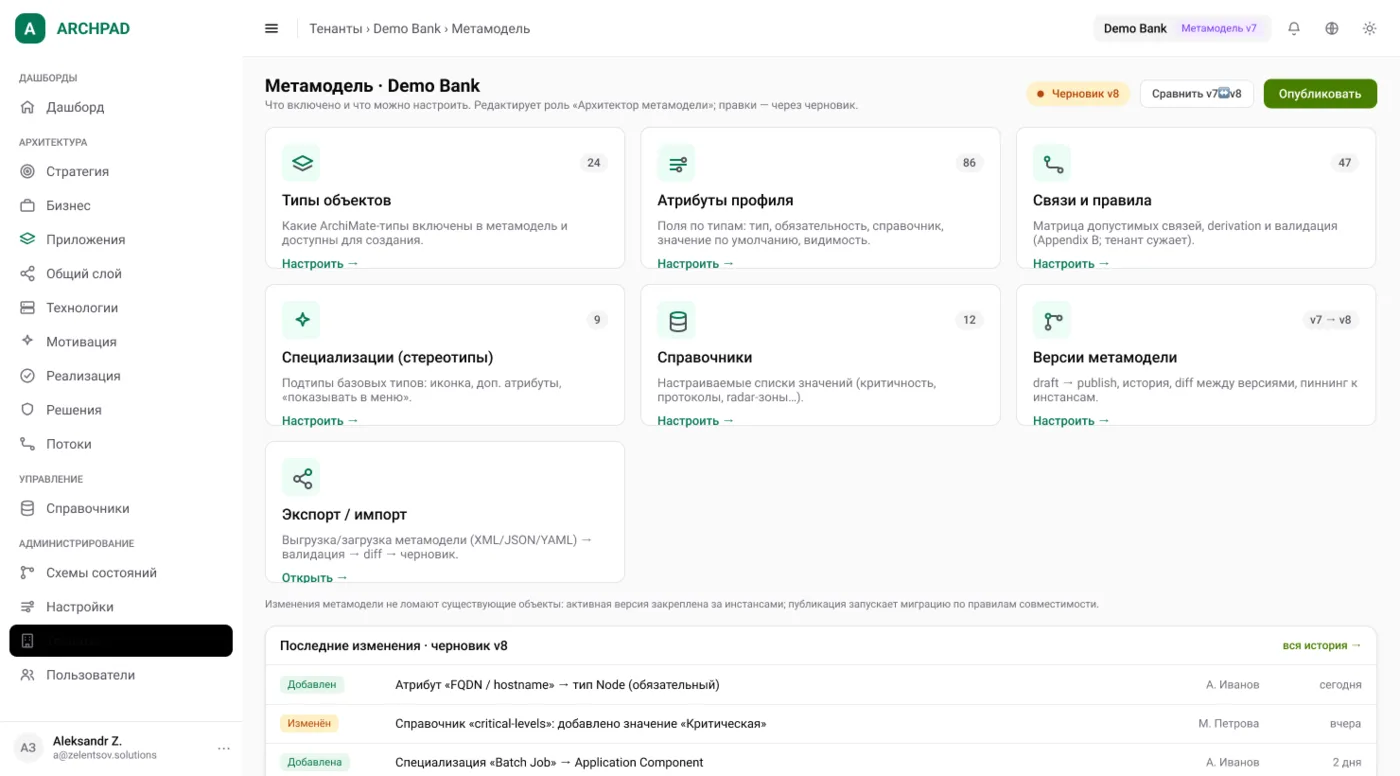
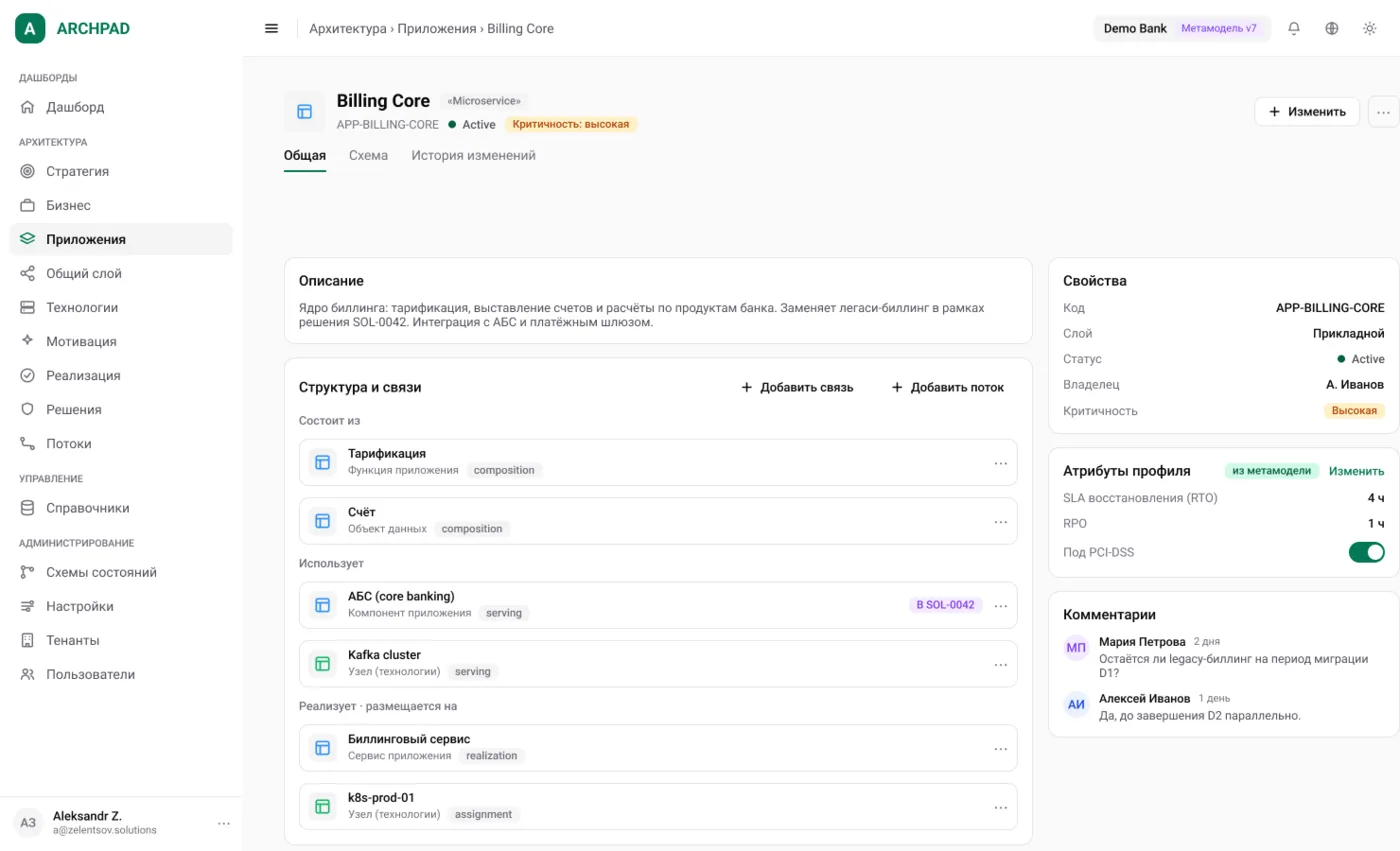
Current analytics and portfolio views
Run your architecture on data
Create an account to explore current dashboards and dependency views
- Configurable metamodel
- Dependency graphs and impact context
- Governance and portfolio dashboards
- Tenant-scoped roles and audit